
Home / Market Updates / June 2026
Tucson housing market · June 2026 · published July 8, 2026
June 2026: the price-cut market.
Prices barely moved while listings piled up — half of everything on the market has taken a price cut. June rewarded prepared buyers and punished overpricing.
MLSSAZ data · June 1 – 30, 2026 · single-family + condo/townhome · updated monthly
Watch the June 2026 market breakdown · [N] min · YouTube — replace URL; delete this block if no video
The metro at a glance
Tucson, in six numbers
Not crashing, not surging — prices held while inventory kept building. 865 homes closed and $380.9M traded in June, with half of all active listings carrying a price cut.
All property types unless noted · MLSSAZ · June 1 – 30, 2026 vs June 2025
Around the metro
City by city
Metro medians hide the local story. Sahuarita and Vail picked up pace while Oro Valley’s sales pulled back — here’s how each submarket actually moved in June.
MLSSAZ sales · June 1 – 30, 2026 vs June 2025 · low-volume areas (under ~20 sales) swing widely month to month
The read
What June's numbers tell us
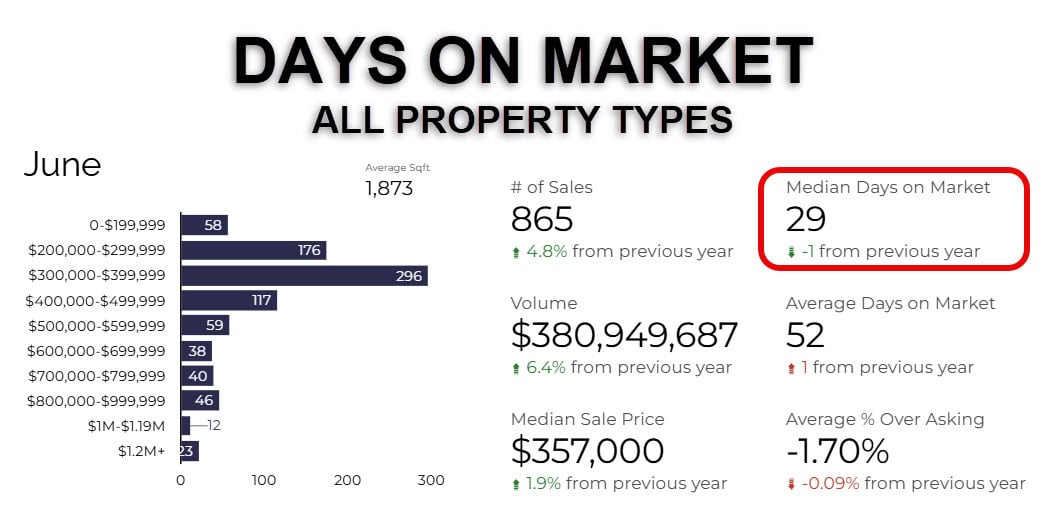
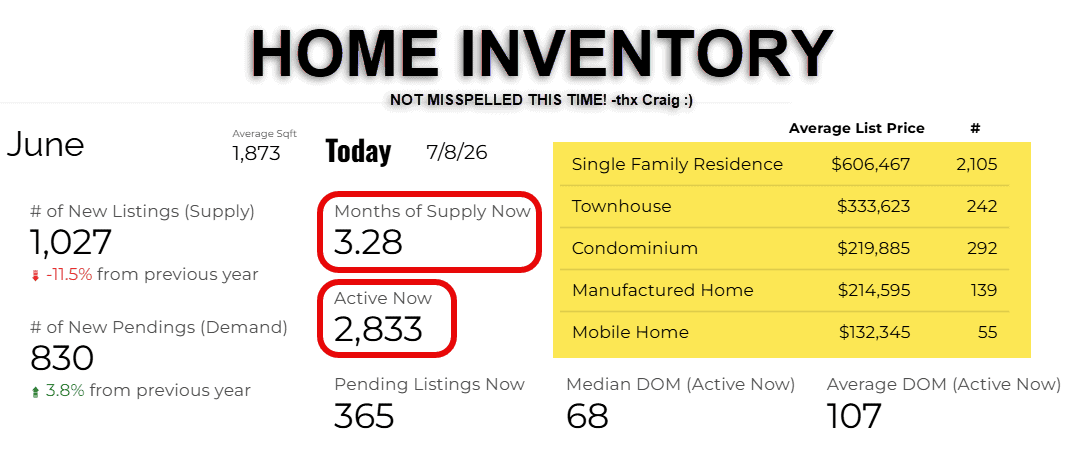
This isn’t a crash — it’s a flat, balanced, and selective market. Buyers are still active: 865 homes closed in June, up 4.8% year over year, even with 30-year rates in the low sixes. With 2,833 active listings and 3.28 months of supply, there’s real selection — healthier than the peak years, if still shy of the four months I’d call truly balanced. The tell is the days-on-market gap: homes that actually sold went under contract in a median of 29 days, while the listings still sitting on the market are running a 68-day median (107-day average). Well-priced, well-kept homes are moving fast; the ones lingering are almost always a price, condition, or location mismatch.
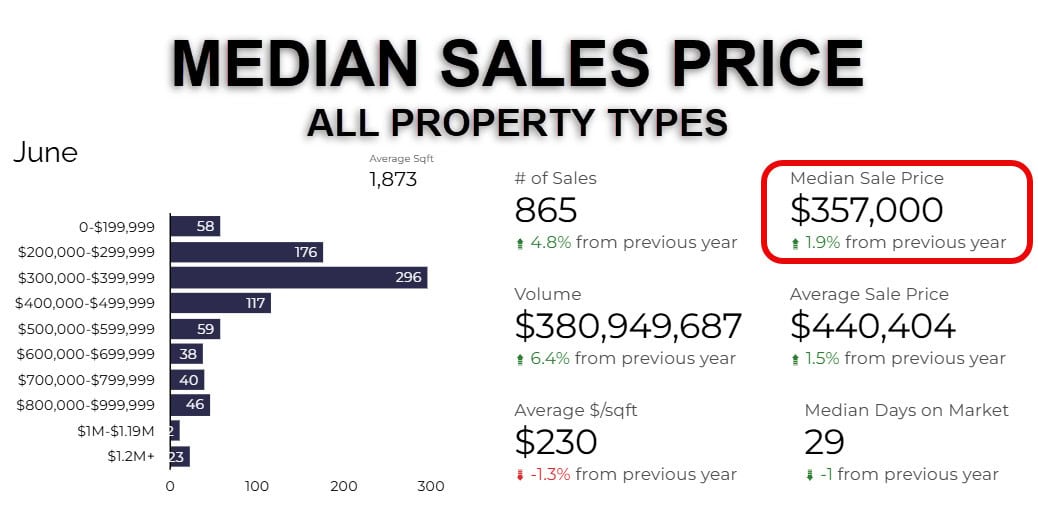
Prices aren’t exploding upward, but they’re not dropping dramatically either. The all-property median rose 1.9% to $357,000 and the average climbed 1.5% to $440,404, while single-family prices held essentially flat at a $375,000 median. Townhomes and condos gained the most — up 6.5% to $278,000 — even as their sales volume fell, a mix of home types and the pull of a more approachable price point (just mind the HOA fees). Average price per square foot slipped 1.3% to $230; a lot of that is larger new-construction out in Vail and the Marana–Dove Mountain area, where you get more square footage for the dollar.
The number that matters most this month is the price-drop data. Half of all active listings — 1,412 of 2,833 — have taken a price cut, and the median home did it just 18 days in. Among closed sales, 42% went through a reduction, finishing 6.8% to 8.3% below their original list price — on a $400,000 listing, tens of thousands left on the table. The lesson is the one we repeat every month: the single biggest detriment to a listing is overpricing it on day one. Price it right, present it well, and buyers — who are hyper-focused right now — will respond.
Market data charts
The trend lines
Closed sales
Median home price
Days on market
Active listings
Where rates sit
The full June report
Every chart, data table, and neighborhood breakdown from June's MLS pull, in one PDF.
FAQ
June 2026, answered
The median sale price for all property types was $357,000, up 1.9% from a year earlier. Single-family homes had a median of $375,000 (flat YoY); townhomes and condos came in at $278,000, up 6.5%.
Balanced, leaning slightly toward buyers. With 3.28 months of supply and 50% of active listings carrying a price reduction, buyers have real negotiating leverage — especially on homes that have been sitting.
Median days on market was 29 days, essentially flat (down 1 day) year-over-year. Well-priced homes still move quickly; overpriced listings tend to see a price cut within a median of 18 days.
$230 across all property types, down 1.3% year-over-year. Single-family homes averaged $235/sqft; townhomes and condos averaged $227/sqft.
As of the June report there were 2,833 active listings — about 3.28 months of supply, meaningful selection for buyers without tipping into oversupply.
Blaine Bond · REALTOR® · Tierra Antigua Realty
What does this market mean for your move?
Every submarket is telling a different story right now. Tell me where you’re looking — or what you own — and I’ll give you the honest read, no pressure.