
Home / Market Updates / August 2026
Tucson housing market · August 2026 · published September 2, 2026
August 2026: prices held, sales didn't.
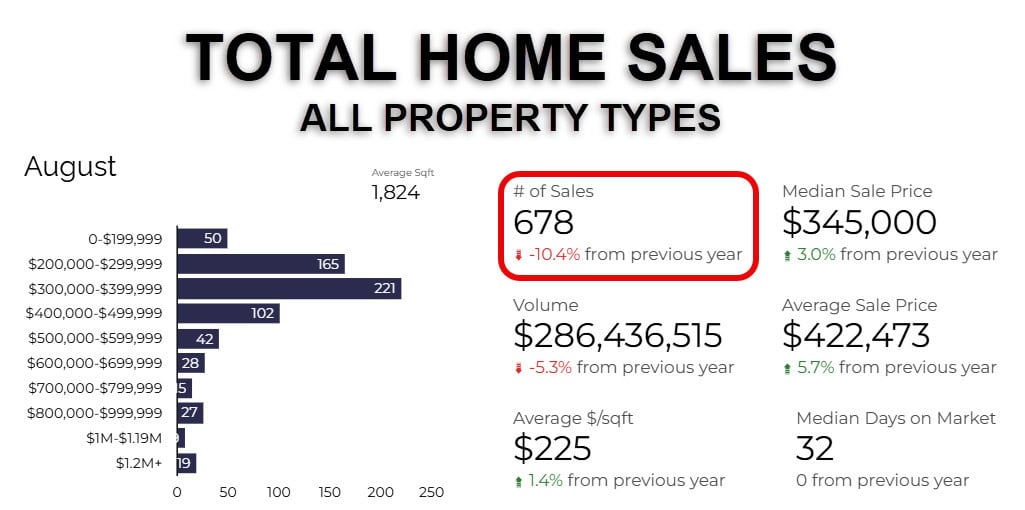
678 homes closed — down 10.4% — yet the single-family median still rose 1.7% to $361,000. Nearly half of active listings already took a price cut. August is telling two stories at once.
MLSSAZ data · August 1 – 31, 2026 · single-family + condo/townhome · updated monthly
Watch the August 2026 market breakdown on YouTube
The metro at a glance
Tucson, in six numbers
Not crashing, not surging — prices held while sales thinned. 678 homes closed, down 10.4% from a year ago, with nearly half of all active listings carrying a price cut.
All property types unless noted · MLSSAZ · August 1 – 31, 2026 vs August 2025
Around the metro
City by city
Metro medians hide the local story. Sahuarita and Vail picked up pace while Oro Valley’s sales pulled back — here’s how each submarket actually moved in August.
MLSSAZ sales · August 1 – 31, 2026 vs August 2025 · low-volume areas (under ~20 sales) swing widely month to month
The read
What August's numbers tell us
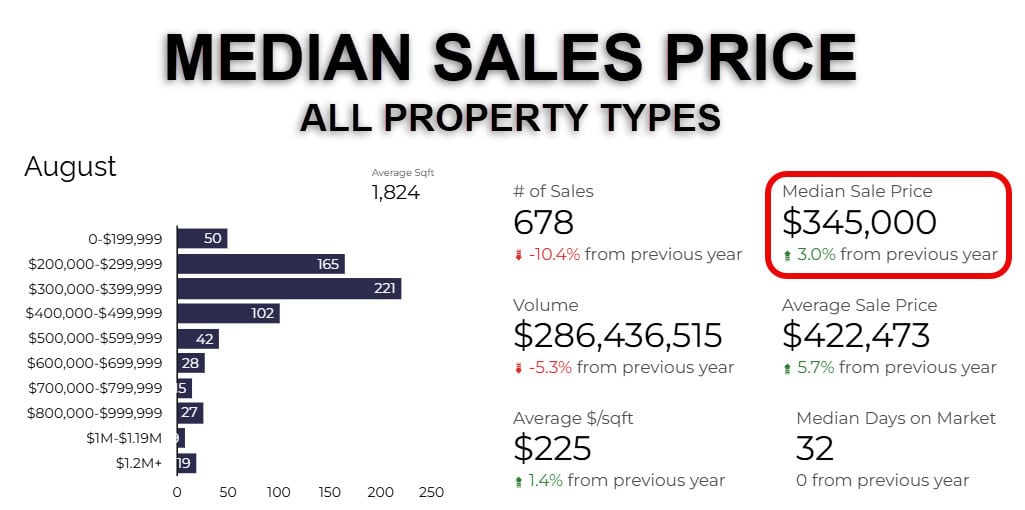
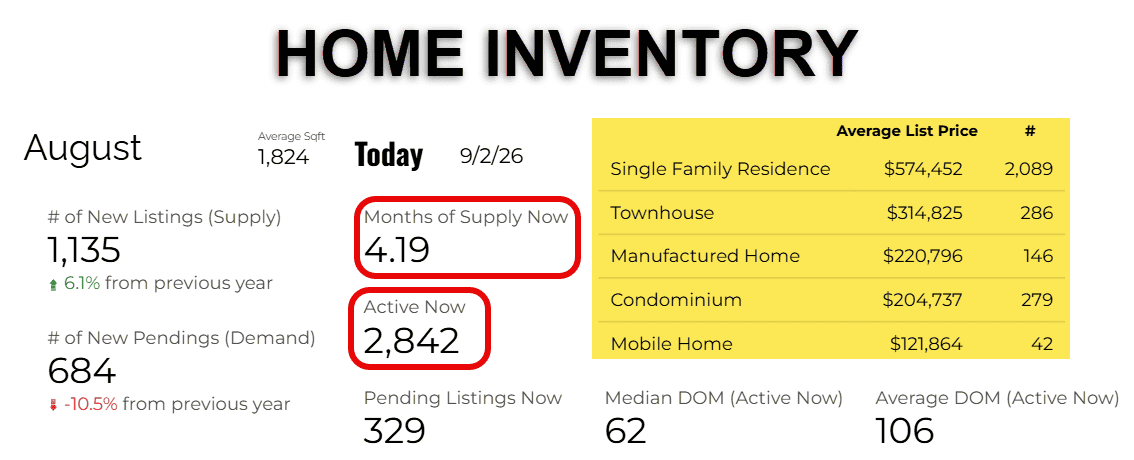
August’s Tucson market is running two tracks at once — and buyers who understand that distinction are in the best position. The overall median sale price came in at $345,000, up 3.0% year-over-year, and the single-family median reached $361,000, up 1.7%. At the same time, only 678 homes closed — a 10.4% drop from August 2025. That combination tells you pricing is holding, but the pool of buyers who can actually get to closing at today’s rates has thinned. With 2,842 active listings and roughly 4.2 months of supply, buyers have real options and real time to make decisions. Homes are closing an average of 1.53% below final asking — and that gap actually improved slightly from a year ago, which means buyers are negotiating, but not hammering sellers into the floor.
For sellers, the August data has a clear message: 48% of active listings have already taken at least one price cut, with the median seller getting that signal just 17 days in. On the closed-sale side, homes that went through a reduction before closing finished an average of 7.8% below their original list price — on a $400,000 home that’s over $31,000 left on the table. The single-family and condo segments are both showing positive pricing on a year-over-year basis, which means the market still supports home values. But it does not support wishful pricing. A properly priced, well-presented home is still selling in roughly a month. An overpriced one is funding someone else’s negotiation.
The standout number is the spread between closed sales and pricing metrics. Sales are down 10.4%, volume is down 5.3%, yet the median is up 3% and price per square foot is up 1.4%. This is not a collapsing market — it’s a constrained one. Affordability at current rates is keeping a meaningful portion of would-be buyers on the sidelines, and those who are moving are being selective. The homes closing are the ones priced correctly and presented well. The ones sitting are priced for a market that existed two years ago.
Market data charts
The trend lines
Closed sales
Median home price
Days on market
Active listings
Where rates sit
The full August report
Every chart, data table, and neighborhood breakdown from August's MLS pull, in one PDF.
FAQ
August 2026, answered
The median sale price for all property types in Tucson was $345,000 in August 2026, up 3.0% from the prior year. Single-family homes had a median of $361,000 (up 1.7%), while townhomes and condos came in at $259,000 (up 7.5%).
Tucson is in a balanced-to-buyer-leaning market as of August 2026. With approximately 4.2 months of supply and 48% of active listings carrying a price reduction, buyers have meaningful negotiating leverage — particularly on homes that have been sitting or were originally overpriced.
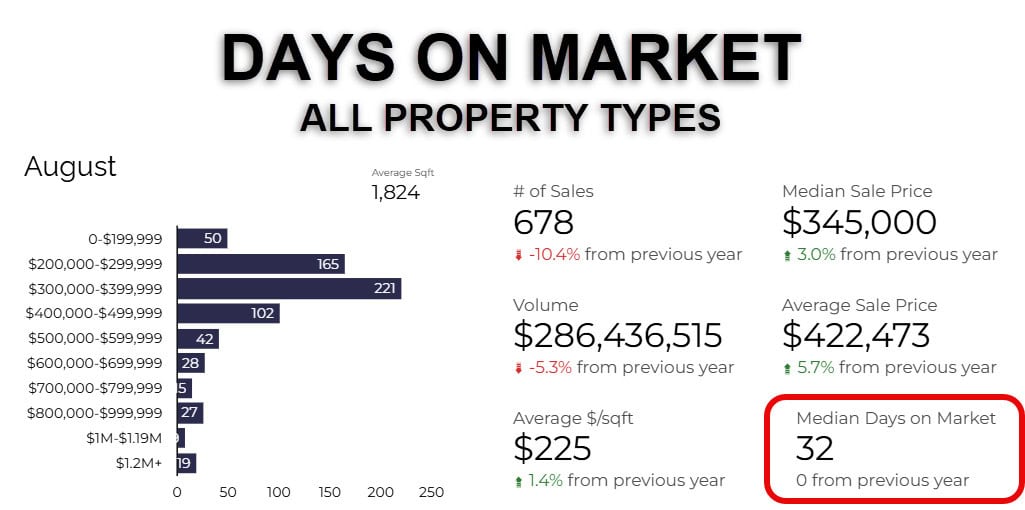
Median days on market for all properties in August 2026 was 32 days, flat compared to a year ago. Well-priced homes are still moving in roughly a month; overpriced listings are seeing price reductions within a median of 17 days on market.
$225 across all property types in August 2026, up 1.4% year-over-year. Single-family homes averaged $231/sqft; townhomes and condos averaged $214/sqft.
As of early September 2026 there were 2,842 active listings — approximately 4.2 months of supply, the most inventory buyers have had to work with in several years.
Blaine Bond · REALTOR® · Tierra Antigua Realty
What does this market mean for your move?
Every submarket is telling a different story right now. Tell me where you’re looking — or what you own — and I’ll give you the honest read, no pressure.