
Home / Market Updates / October 2026
Tucson housing market · October 2026 · published November 6, 2026
October 2026: sales slow sharply, prices hold steady.
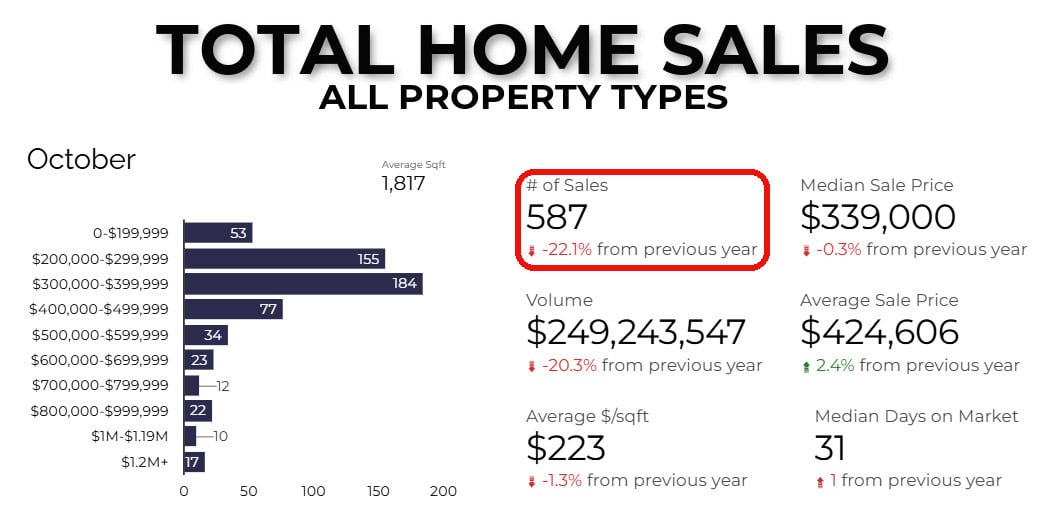
587 homes closed — down 22.1% — while active inventory sat at 3,252, more than five and a half months of supply. The median sale price was nearly flat at $339,000, down 0.3%. Half of active listings have already cut their price.
MLSSAZ data · October 1 – 31, 2026 · single-family + condo/townhome · updated monthly
Watch the October 2026 market breakdown on YouTube
The metro at a glance
Tucson, in six numbers
Fewer closings, steady prices, the deepest selection in years. 587 homes closed, down 22.1% from a year ago, while active inventory sat at 3,252 — about 5.5 months of supply — and 50% of listings have already cut their price.
All property types unless noted · MLSSAZ · October 1 – 31, 2026 vs October 2025 · inventory as of November 3, 2026
Around the metro
City by city
Metro medians hide the local story. Green Valley and Marana moved fastest in October — 29 and 34 median days — while Vail listings took more than two months. Oro Valley was the only area with more closings than a year ago. Here’s how each submarket closed out the month.
MLSSAZ sales · October 1 – 31, 2026 · low-volume areas (under ~20 sales) swing widely month to month
The read
What October's numbers tell us
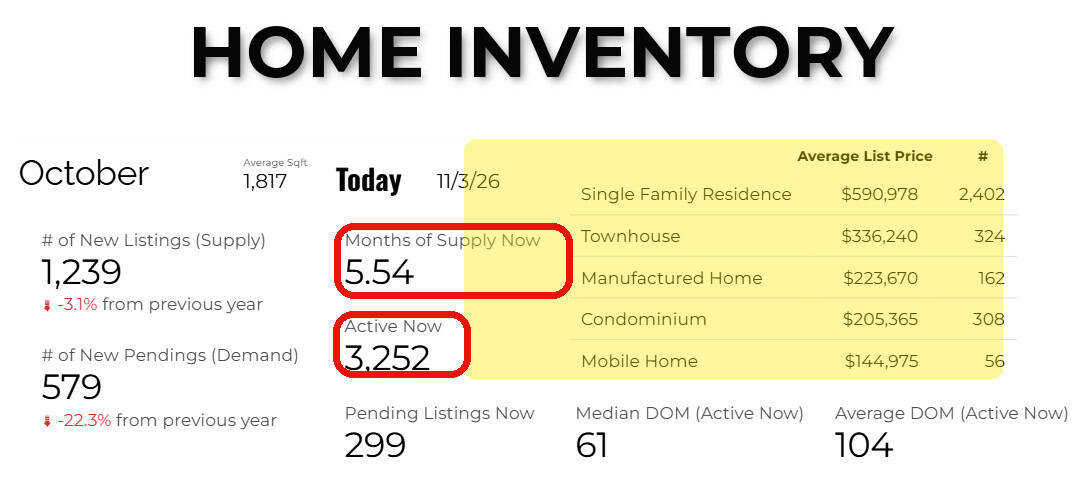
October’s Tucson market slowed hard on volume and barely moved on price — that is the whole story. Closings fell to 587, down 22.1% from October 2025, and sales volume came in at $249.2 million, down 20.3%. Yet the overall median sale price held at $339,000, down just 0.3%, and the average price rose 2.4% to $424,606. Homes closed an average of 1.96% below their final asking price, with sellers netting roughly 98.0% of the last list price. Active inventory stood at 3,252 on November 3, about 5.54 months of supply, with 299 pending. Buyers have the most selection and the most time they have had in years, and prices have not yet followed the slowdown.
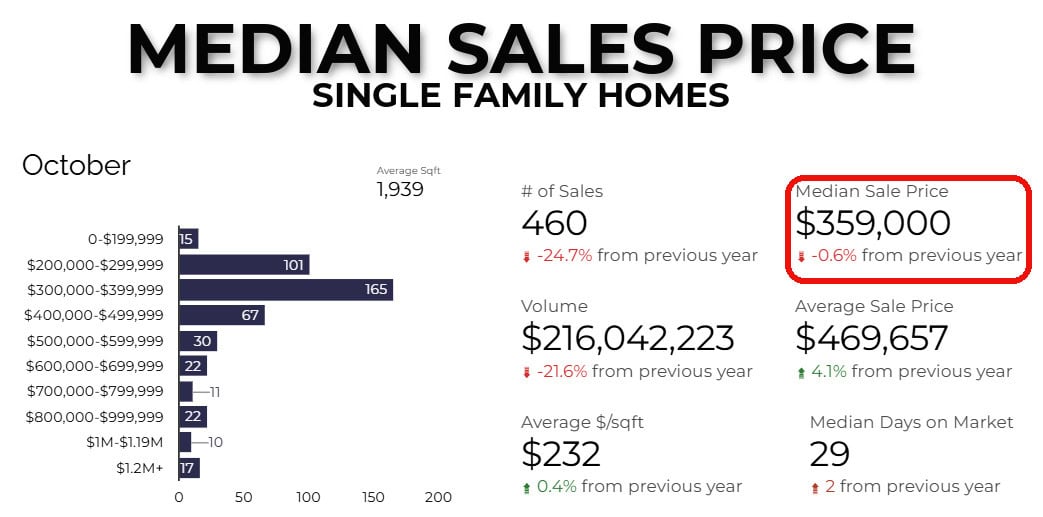
For sellers, the price-cut data is the message. 50% of active listings — 1,612 homes — have already taken at least one reduction, with the median seller cutting after just 15 days and the average active reduction running 6.5%. Among homes that closed between October 1 and November 1, 41% had reduced their price, and those sellers finished an average of 9.9% below their original list price — on a $400,000 home, that is nearly $40,000 given back one cut at a time. Single-family medians were essentially flat at $359,000 (down 0.6%) on 460 sales; townhomes and condos held at $250,000 on just 93 sales, so read that number as mix-driven. Pricing to today’s comparables on day one still beats chasing the market down.
Rates are the pressure point. The 30-year fixed stood at 7.24% on October 29 and the 15-year at 6.60%, and the purchase mortgage application index sat at 134.1 for the week of October 19. New pending contracts fell 22.3% to 579 in October, and active listings are now sitting a median of 61 days. Financed buyers should compare the full package — seller concessions, closing-cost help and rate buydowns — not just the sticker price. With more than five months of supply, this is the most negotiable Tucson market in several years, and the well-priced, well-presented homes are the ones still closing.
Market data charts
The trend lines
Closed sales
Median SF sales price
SF median days on market
Active listings · November 3
Where rates sit
The full October report
Every chart, data table, and neighborhood breakdown from October's MLS pull, in one PDF.
FAQ
October 2026, answered
The median sale price for all property types in Tucson was $339,000 in October 2026, down 0.3% from the prior year. Single-family homes had a median of $359,000 (down 0.6%), while townhomes and condos came in at $250,000 (unchanged, on just 93 sales).
Tucson is leaning toward buyers as of late fall 2026. With 3,252 active listings, about 5.54 months of supply as of November 3, and 50% of active listings carrying a price reduction, buyers have real negotiating leverage — particularly on homes that have been sitting past the 61-day median for active listings.
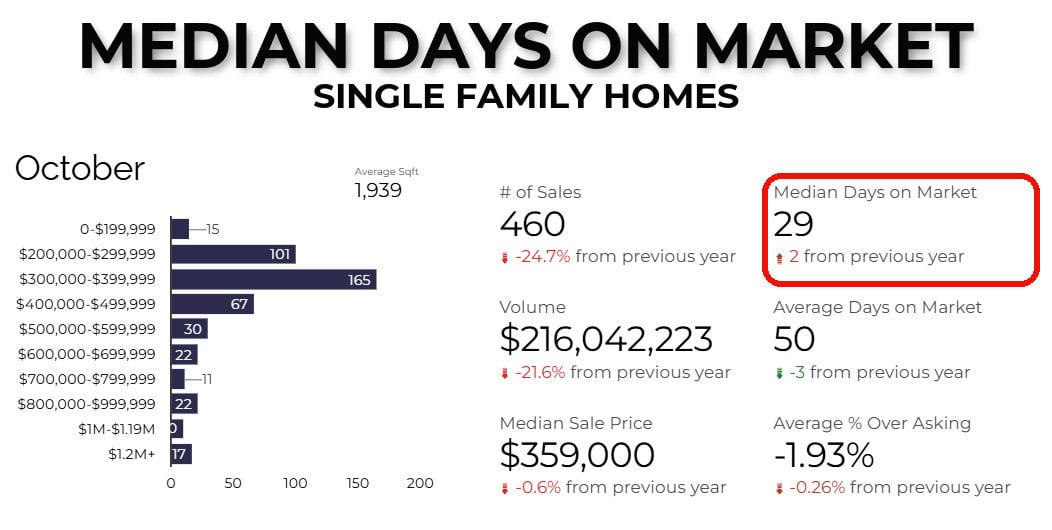
Median days on market for homes that closed in October 2026 was 31 days (single-family 29, townhomes and condos 39), with the average at 52 days. Listings still active have been on the market a median of 61 days, and the median seller who reduced their price did so after 15 days.
$223 across all property types in October 2026, down 1.3% year-over-year. Single-family homes averaged $232/sqft (up 0.4%); townhomes and condos averaged $207/sqft (down 6.0%).
As of November 3, 2026 there were 3,252 active listings and 299 pending listings — approximately 5.54 months of supply. October brought 1,239 new listings (down 3.1% year-over-year) and 579 new pending contracts (down 22.3%).
Blaine Bond · REALTOR® · Tierra Antigua Realty
What does this market mean for your move?
Every submarket is telling a different story right now. Tell me where you’re looking — or what you own — and I’ll give you the honest read, no pressure.